Why do I need a tick chart
 17 / 02 / 20
Visitors: 765
In the modern high-tech world, where Internet and online work have long been the norm, an exchange speculator working at a computer receives from his broker a continuous stream of quotes for various exchange instruments. In particular, for those exchange instruments that he himself uses in his exchange trading.
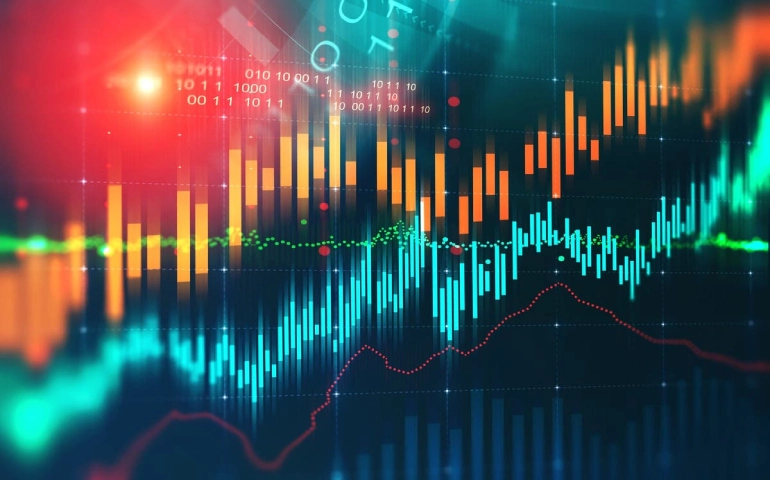
A tick chart is a chart of an exchange instrument that displays a detailed change in the price of a selected asset. That is, a tick chart is a chart on which each tick is displayed.
Types of tick charts:
- ascending - the current transaction was made at a price higher than the previous one;
- descending - the current transaction was made at a price lower than the previous one;
- zero - the current transaction was made at the same price as the previous one.
Why do I need a tick chart?
Tickchart is mainly used to identify support and resistance levels. With its help, you can increase the effectiveness of trading if you competently examine the price behavior of a certain graphic design. The trader has the opportunity to monitor local highs and lows, but small scales will not be able to provide the necessary amount of useful information.
Using this analysis method, it is possible to remove market noise. The tick chart is better in terms of exact options than temporary designs, where quotes may fluctuate non-uniformly and do not provide all the information.
But it is worth remembering that the tick chart displays exactly the instant price. And the price does not always move in single ticks. Sometimes, if there is a lot of volatility on the market, then sharp price changes are possible, where the distance between ticks can be tens or even hundreds of points.
Application
The tick chart shows itself perfectly along with the Fibonacci levels, Gann grid, Andrews lines, because it shows the price fluctuation inside the bar. Because of this, there is no time frame, since each subsequent indicator follows after the formation of the previous tick.
It is worth paying attention to quotation providers, the quality of their services depends on the accuracy and information content of the analysis. Professional traders most often use paid software packages in which there are different options for tick charts.
Tickchart is not intended for trading. This is simply information regarding the price data received, so that the exchange speculator can, if necessary, track at what price his transaction was made.
A lot of advisers are built on tick charts that provide such information:
1. Fixing historical data in a special file, which is used for analysis later.
2. Demonstration of bar ticks.
3. Moving averages are calculated and demonstrated using tick quotes.
4. Image of a chart with indicators in a separate window.


